Inteplast Group, Ltd.

• Created a disease classifier that identifies data science cardiovascular disease (Accuracy: 81%) to help
doctors notice the disease
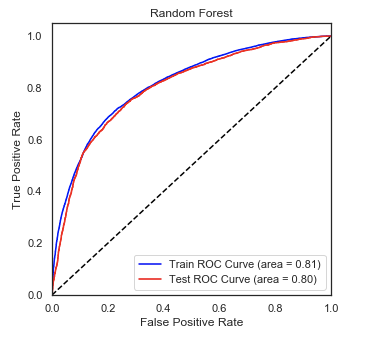
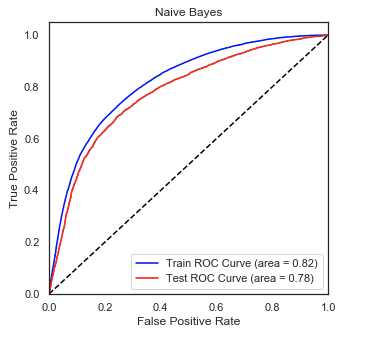
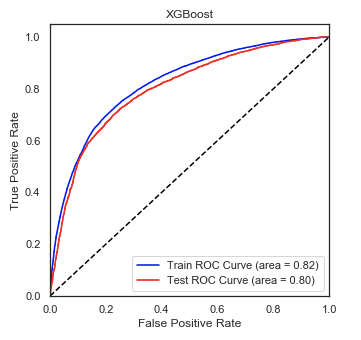
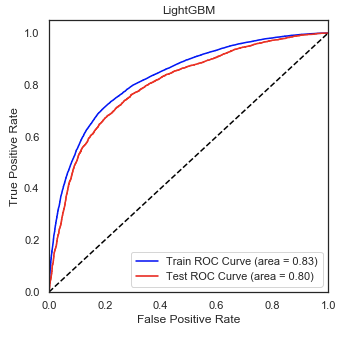
• Optimized Logistic Regression, K Nearest-Neighbors, Naive Bayes, XGBoost, LightGBM, and Random Forest
Regressors using GridSearchCV to reach the best model.
• Used data set of Cardiovascular Disease in Kaggle
• Built a model explanation using SHAP.
In the dataset, we got the following features:
• General information: age, weight, height, and gender
• Physical index: systolic blood pressure, diastolic blood pressure, cholesterol, and glucose
• Living habits: daily smoking, alcohol intake, and physical activities
• Target: Whether they are a cardiovascular disease patient
I needed to clean it up so that it was usable for our model. I made the following changes and created the
following variables:
• Scaled the feature to standardization.
• Splitted the data into train and validation sets with validation size of 20%
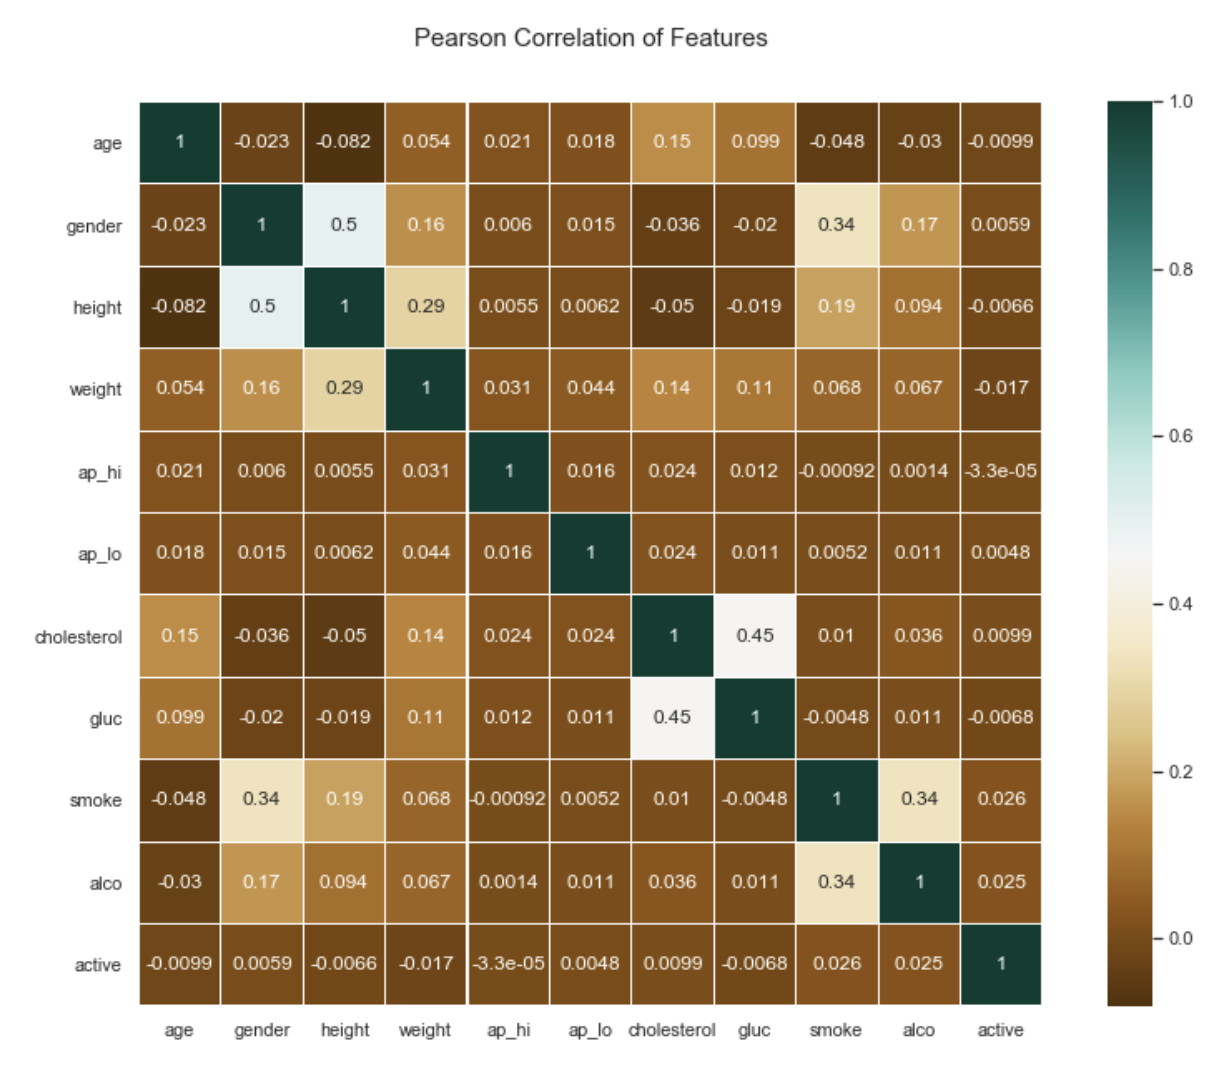
• I looked at the normality of the data, the correlation with the various variables. Below are a few
highlights from the figures. Correlation with other features: